Conversational Intelligence
Your customers tell you what they want every day, in their own words.
Every question asked of your AI is an unprompted signal from someone in the middle of a decision. Conversational Intelligence turns thousands of those conversations into structured insight your teams can act on — the themes you didn't know to look for, who is asking about them, and the part of your organisation that owns the answer.
The problem:you're reporting on a channel, not listening to a market
Most organisations measure website AI the way they measure a phone queue — conversation volume, deflection rate, resolution time, satisfaction score. Those numbers describe the efficiency of a channel. They say almost nothing about what customers were trying to do.
- Thousands of people describe their needs in their own words every month, and nobody reads it.
- The themes you already knew about get counted. The ones you didn't stay invisible.
- Everything is one blended average, so you cannot see what international applicants, part-time learners or new residents ask that nobody else does.
- By the time a new issue shows up in complaints or call volumes, it is weeks old.
- Insight that isn't attached to an owner never turns into a change.
- Meanwhile you pay for surveys and panels to ask a few hundred people what thousands have already told you.
Conversational data is the most honest market research your organisation will ever own. Most organisations throw it away.
Three ways to understand what customers want
Most organisations invest in the first two and assume they're covered.
Surveys, panels and focus groups
- Prompted — you only learn about what you thought to ask
- Sampled — a few hundred responses stand in for everyone
- Periodic — fieldwork measured in weeks or quarters
- Recalled after the fact, not captured in the moment
- Significant recurring cost for every wave
Chat and support reporting
- Measures the channel: volume, deflection, resolution, CSAT
- Counts only the categories you defined in advance
- One blended average — nothing by audience or segment
- New issues surface after they become complaints
- Rarely reaches marketing, product or executive teams
Airgentic Conversational Intelligence
- Unprompted — themes discovered from what people actually asked
- Complete — every conversation, not a sample
- Segmented — what each audience asks that the others don't
- Captured at the moment of decision, refreshed continuously
- Mapped to your structure, with a named owner per category
- Included with your existing Airgentic deployment
1. Discover what you didn't know to look for
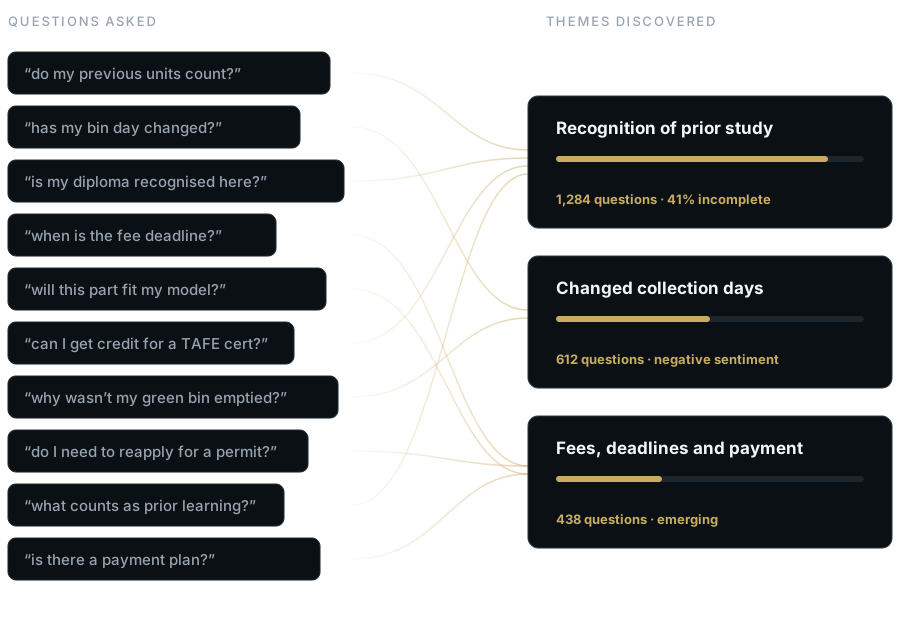
Airgentic groups conversations into themes by meaning rather than keywords, so “do my previous units count” and “is my diploma recognised here” land in the same theme even though they share almost no words.
What you get
- Themes, not keywords — Each theme is labelled in plain language and tracked over time, so this month is comparable with last month.
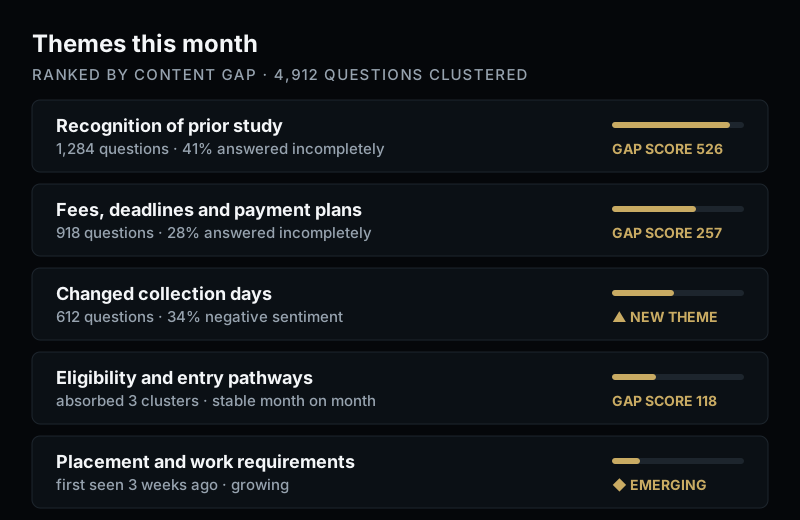
- Volume and answer quality together — See which themes are large, which are answered badly, and which are both.
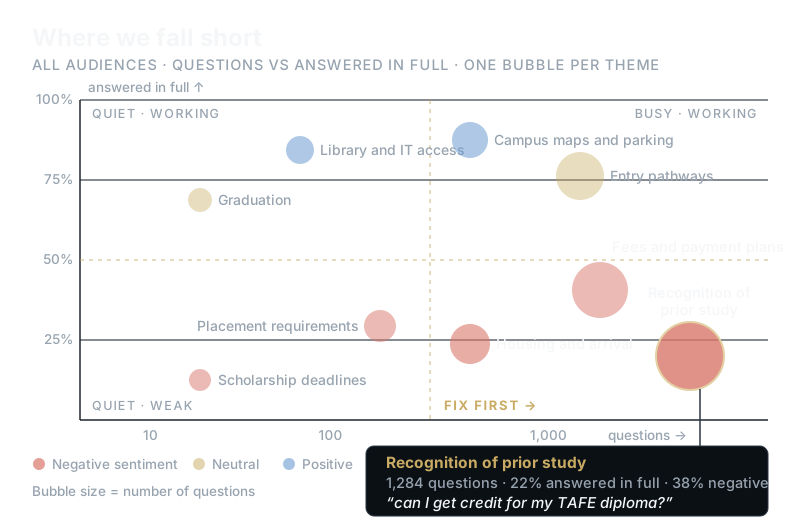
- Content gaps, ranked — Themes are scored by volume and how often the answer fell short, so the highest-value fix is obvious.
- Emerging themes flagged early — New clusters are surfaced as they form, before they reach your contact centre.
A word cloud tells you which words were common. Clustering tells you which needs were common — which is the part you can act on.
2. Classify against the structure of your business
Themes tell you what customers raised. Categories tell you who owns it.
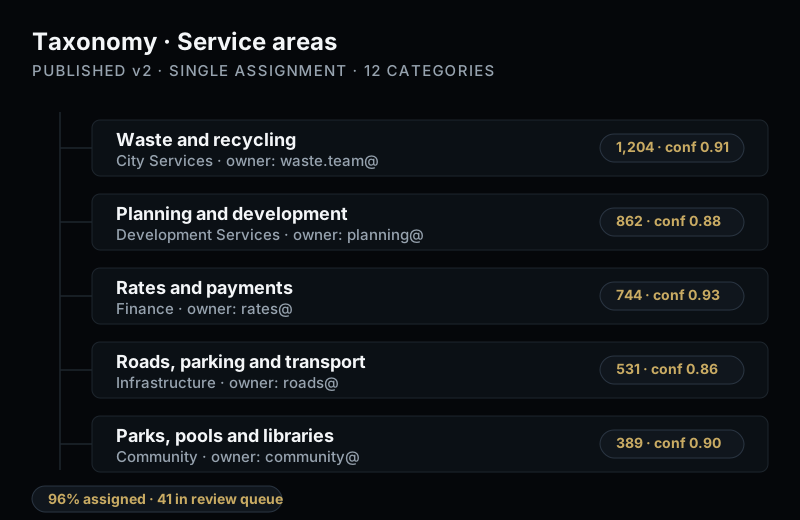
You define a taxonomy that matches how your organisation actually works — faculties, service areas, product lines, regions, enquiry types — and every question is classified against it automatically.
How it works
- Your categories, your language — Hierarchical categories, each with a named owner and contact.
- Trained on your own content — Point a category at a section of your site, add a short brief, or supply example and counter-example questions.
- Confidence-scored — Confident matches are assigned automatically; borderline ones are queued for a person.
- Governed and versioned — Publish a taxonomy to lock it for stable reporting, and create a new version when the business changes.
The result is one consistent view of demand that a faculty dean, a service manager and a marketing director can all read.
3. Hear each audience, not the average
Themes tell you what was asked. Voice of Customer tells you who was asking — and what each audience raises far more than everyone else.
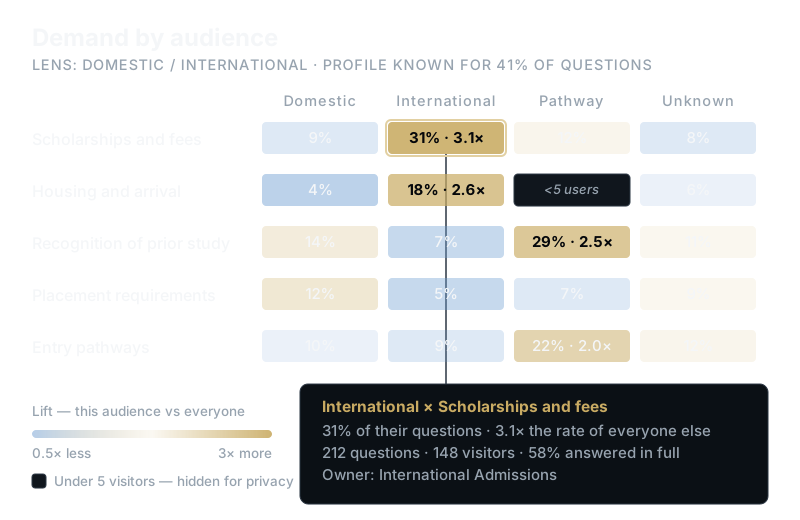
When your assistant collects visitor profiles — domestic or international, study mode, campus, customer type, suburb — every theme can be read through that lens. A heatmap crosses themes against one audience field at a time and colours each cell by lift: how much more, or less, that audience asks about the theme compared with everyone.
What the report shows
- Who visited — The mix of audiences in the period, so you can see a campaign land or a segment go quiet.
- What each audience asks — Cells with high lift are the findings — international enquirers raising housing and arrival 2.6× more than anyone else.
- Where we fall short — Themes that are both busy and poorly answered, so the highest-value fix is obvious.
- In their words — Representative questions behind every number, one click from the full conversations.
Every view states its coverage — how many questions had a known profile — and any group under five visitors is hidden, so the report describes audiences without exposing individuals.
4. Cross-reference, and the answer appears
This is where conversational data stops being interesting and starts being useful.
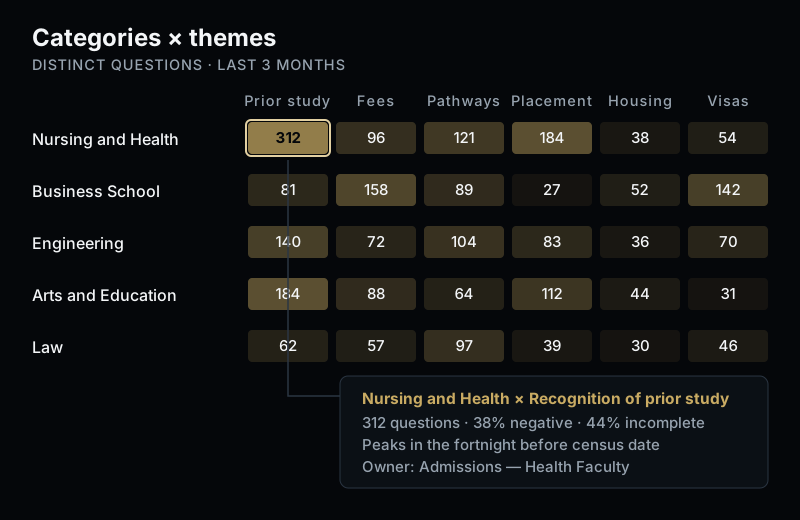
Put discovered themes on one axis and your business categories on the other, and the intersections light up: which part of the organisation a theme belongs to, where sentiment is worst, where demand is growing, and who needs to do something about it.
What the crossover reveals
- Where a theme concentrates — One hot cell tells you a theme is overwhelmingly about a single department, product line or region.
- Who is behind it — Switch on the audience lens and the same cell tells you which segment is driving it — often not the one you assumed.
- What changed this month — Spikes, drops, new themes and themes that have disappeared, compared with previous months.
- Where frustration sits — Sentiment aggregated by category and theme, so you can tell high volume apart from high frustration.
- The questions behind any number — Every cell drills through to the real conversations, with timestamps and full context.
Export any view to CSV, or pull the underlying records through the Analytics API into your own BI stack.
Questions you can finally answer
Reporting tells you what happened. These are the questions leadership actually asks — and this is the evidence base for them.
- What are customers asking for that we don't currently offer?
- What does each audience ask about that nobody else does?
- Which new issues emerged this month that nobody has escalated yet?
- Where is our content failing the most people who were ready to act?
- What is driving negative sentiment in a department, product line or region?
- Who in the organisation owns each of these, and do they know?
Every one of them is answerable from data you are already collecting.
One dataset, five different jobs
Marketing and communications
Write from evidence instead of assumption.
- Demand languageThe words customers use, before you write the campaign
- Audience differencesWhat international, regional or first-in-family enquirers ask that others don't
- Campaign impactWatch the question mix — and the audience mix — shift after a launch
Product and service owners
Know what to build, fix and retire next.
- Unmet demandRequests for things you don't currently offer
- Friction pointsWhere people ask the same thing repeatedly
- PrioritisationVolume, sentiment and audience behind every request
Operations and service delivery
See it before the queue does.
- Early warningEmerging themes flagged as they form
- Avoidable contactThemes that should never need a human
- HotspotsWhere an issue is concentrated geographically
Digital and content teams
Fix the pages that actually matter.
- Ranked gapsHighest-volume, worst-answered themes first
- Right page, right audienceGaps that only one segment is hitting
- Proof of impactCompleteness recovering on themes you fixed
Executive and strategy
A monthly read on what customers care about.
- What changedNew, growing and resolved themes each month
- Who you serve wellWhich audiences get complete answers, and which don't
- Evidence for decisionsVolume-backed demand for planning and budgets
In higher education
Prospective students describe their decision criteria in their own words, at the exact moment they are comparing you with someone else. That is market research your recruitment team would otherwise pay for.
A worked example
- Categories — Faculties and schools, course level, and applicant type — domestic, international, pathway.
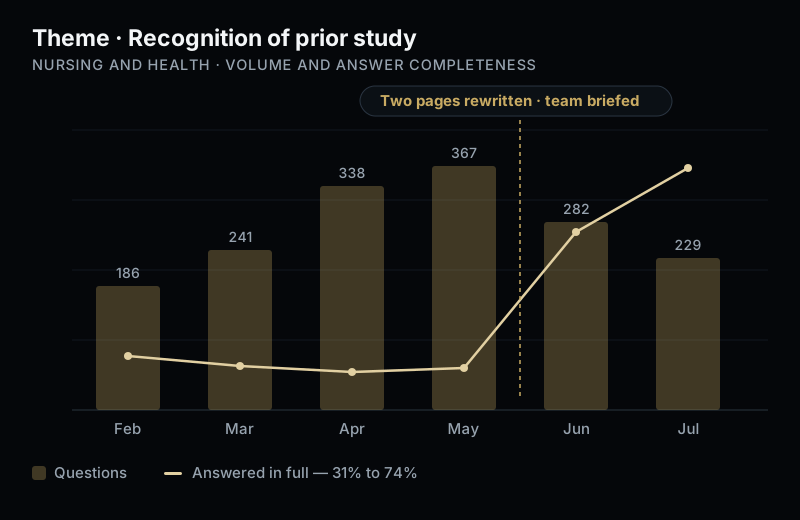
- A theme nobody planned for — Clustering surfaces a persistent theme about credit and recognition of prior study: high volume, frequently answered incompletely.
- Who is asking — The audience lens shows pathway applicants raise it 2.5× more than anyone else, and international applicants barely at all — so the fix is a page for TAFE and diploma entrants, not a general FAQ.
- The crossover — It concentrates in two schools, and negative sentiment climbs in the fortnight before the census date.
- The action — Rewrite two pages, brief the admissions team, and watch answer completeness on that theme recover the following month.
The same view shows which markets are warming, which fee and scholarship concerns dominate for international enquirers, and which worries are growing across an intake — while the intake is still open.
In local and state government
Residents tell you which services confuse them, which changes didn't land, and where a local issue is building — days before it reaches the call centre, the councillor's inbox or the local paper.
A worked example
- Categories — Service areas, intent — report, apply, pay, find out — and suburb or ward.
- A theme nobody planned for — A cluster forms around changed bin collection days after a route revision.
- Who is asking — A resident-type field on the profile shows it is new residents, not long-term ratepayers — the change never reached people who moved in after the letterbox drop.
- The crossover — Volume concentrates in three suburbs within days, with clearly negative sentiment.
- The action — Targeted proactive comms to those suburbs and a note in the new-resident pack, instead of discovering the problem from a spike in calls.
Over a quarter the same data becomes evidence: which services generate the most avoidable contact, where online information is failing residents, and which service redesigns are worth funding.
From signal to action
Insight only counts if something changes. Conversational Intelligence is built to run as a rhythm, not a research project.
- Continuously refreshed — Clustering runs with your content crawl schedule and classification runs daily, so themes stay current without anyone starting a job.
- A monthly digest by email — Subscribers get the month's content gaps, spikes and drops, new and lost themes, and emerging clusters. No login required.
- A review queue, not a black box — Borderline classifications go to a person to confirm or correct, and those corrections are respected from then on.
- Named owners — Every category records the person or team accountable, so findings have a destination.
- Straight to the transcript — Any number on any chart opens the conversations behind it.
When a theme needs a better answer today, curate it once with Human Override and everyone who asks next gets the improved answer.
Governance, accuracy and privacy
Insight that can't be explained doesn't survive its first committee meeting.
- Every number is traceable — Themes, categories and metrics drill back to the conversations behind them, with citations to the source content used in each answer.
- Confidence, not guesswork — Classifications carry a confidence score, and borderline cases are queued for human confirmation rather than quietly assigned.
- Human decisions stick — Confirmed and corrected assignments are preserved and respected by later runs.
- Stable reporting — Published taxonomies are locked and versioned, so trends stay comparable over time.
- Audiences, never individuals — Voice of Customer aggregates only non-personal profile fields — short lists of values and yes/no flags — shows one lens at a time, and hides any group under five visitors. Names and emails never appear.
- Access control and audit — Role-based access, source-level permissions and audit trails across the admin console.
- Privacy by design — Configurable retention windows, privacy controls, and AU/NZ data residency options.
Analysis works on the questions people asked and the conversations they had, inside the retention window you configure.
Getting started
- Included — Conversational Intelligence comes with Airgentic Search and Agentic AI deployments. There is no new data collection to set up.
- Day one — Turn on clustering and themes begin forming from the questions you are already receiving.
- Week one — Define your first taxonomy — 10 to 20 categories is plenty — point each category at the relevant part of your site, and publish.
- Voice of Customer — Switch on visitor profiles with at least one reportable field — domestic / international, study mode, campus, customer type — and the audience report appears with no further setup.
- Ongoing — Classification runs daily, clustering follows your crawl schedule, and the digest arrives monthly.
- Volume needed — Clustering needs at least 10 distinct questions in a month to produce meaningful themes, so a very low-traffic service takes longer to build a picture.
If you already run Airgentic, the data is there. This is the part where you start reading it.
FAQs
How is this different from Customer Insights?
Customer Insights is the operational view: answer quality, review queues, conversation-level detail, and what happened recently. Conversational Intelligence is the strategic layer above it: discovered themes, your own business categories, month-on-month change, and where demand is concentrating. They read the same conversations, and both are included.
Isn't this just reading chat logs?
No. Reading logs doesn't scale past a few hundred conversations, and it can't tell you whether a theme is growing. Clustering groups questions by meaning across your entire volume, tracks the same themes month to month, and scores them by volume and answer quality so you know which one to act on first.
What do we need for Voice of Customer?
Visitor profiles enabled on your assistant, with at least one reportable field — such as domestic / international, study mode, campus or customer type. Once that field is being recorded, the Voice of Customer report appears alongside themes and categories. Coverage is shown on every view, so you always know what share of questions the audience findings describe.
Can audience reporting identify individuals?
No. Only non-personal profile fields with a fixed set of values, or yes/no flags, are aggregated — names, emails and free text are never used. One audience lens is shown at a time so fields can't be crossed into tiny identifying cells, and any group with fewer than five distinct visitors is hidden.
Do we need a data team or a BI tool?
No. The dashboards are point-and-click and the monthly digest arrives by email. If you do have a BI stack, export any view to CSV or pull the records through the Analytics API.
How accurate is the classification?
Every assignment carries a confidence score. Confident matches are assigned automatically, borderline ones go to a review queue where a person confirms or corrects them, and those corrections are respected afterwards. Quality metrics — assignment rate, average confidence, category clarity — are reported so you can see how well your taxonomy is performing.
How current is the data?
Classification runs daily and clustering runs with your content crawl schedule, so themes reflect recent conversations. Theme comparisons are made on calendar months, so month-on-month trends firm up as the month completes. You can also trigger an analysis manually at any time.
How much conversation volume do we need?
Clustering needs at least 10 distinct questions in a month to form meaningful themes. Most public-facing sites clear that comfortably; a low-traffic internal service may take a few months to build a useful picture.
What about privacy and data residency?
Access is role-based with audit trails, retention windows are configurable, and AU/NZ data residency options are available. Analysis works on the questions asked and the surrounding conversation, inside the retention window you configure.
Start reading what your customers are already telling you
If you're running Airgentic, these conversations are being captured right now. The only question is whether they're being read.
- See the themes discovered in your own conversations
- Find out what each audience asks that the others don't
- Map them to your faculties, service areas or product lines
- Get the monthly digest of what changed and who owns it
Included with Airgentic Search and Agentic AI deployments.
Still have questions?
Ask our AI — get cited answers about conversational intelligence, themes, taxonomies, audiences and demand signals.