Right now, someone somewhere in the world is asking your website a question. Ever wondered what that looks like?
Every question is someone telling you what they need.
- A prospective student in Mumbai exploring engineering courses.
- Someone in Brisbane looking for parking information.
- A couple in Newcastle planning their wedding.
Most of the time, those interactions end up as numbers on a dashboard. Useful, certainly. But it's easy to forget there's a real person behind every one.
So we built something a little different.
Introducing Live Map, a new way to see your audience engaging with your organisation in real time.
How Live Map works
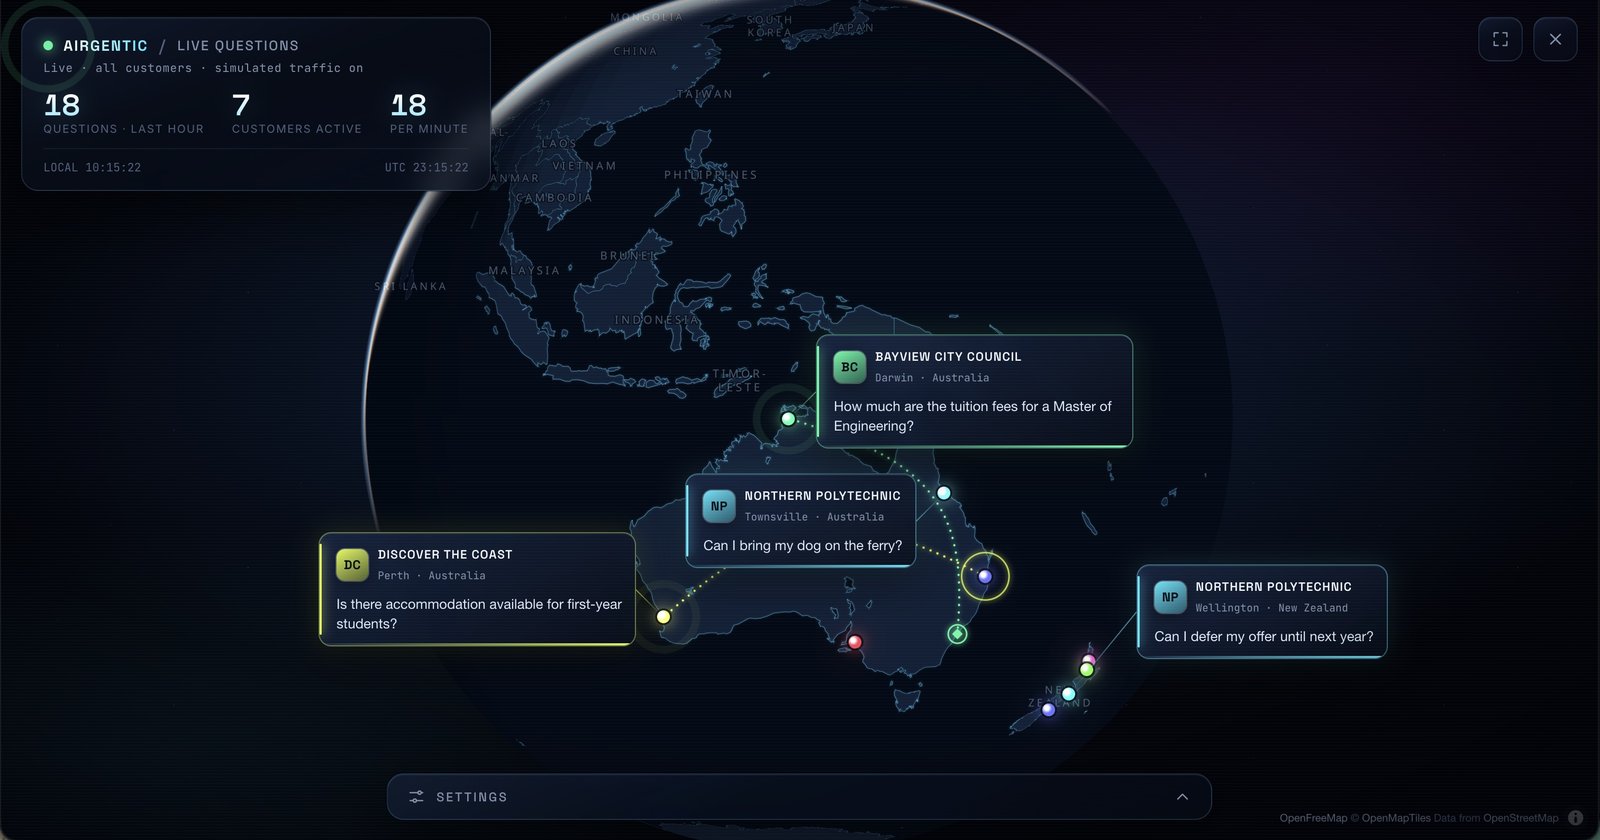
It's an interactive globe that brings your website's conversations to life.
When someone asks your Airgentic AI assistant a question, a pin lights up on the globe showing their approximate location. Their question appears alongside it, and a dotted arc connects them to your organisation's head office.
As more people interact with your website, the globe comes alive with activity from around the world.
We've been watching it, and it's oddly mesmerising.
Will it change your KPIs? Probably not. But it does something a spreadsheet can't. It makes your audience feel real.
It reminds us that behind every search, every question and every conversation is someone trying to accomplish something. And that our job is to make their experience as helpful as possible.
It's a different way to experience your analytics, whether you're exploring where your audience is coming from, sharing insights with your team, or bringing a little more humanity into your next board presentation.
What we cared about
- Privacy: Locations are approximate and shown at city level only. Email addresses and phone numbers are removed from questions before they're displayed.
- Instant activity: Open Live Map and the last hour of activity is already there. No waiting for the first conversation.
- Full-screen experience: One click turns your analytics into an interactive globe.
Live Map will be available to Airgentic customers in their analytics from 17 November 2026.
Because sometimes the best way to understand your audience isn't another chart. It's a reminder of the people behind the numbers.
If you'd like to see your website's conversations come to life like this, get in touch.